The digital look at reality
To each his own view, changeable at any time and always on hand: whether on the smartphone, the PC or a large screen.
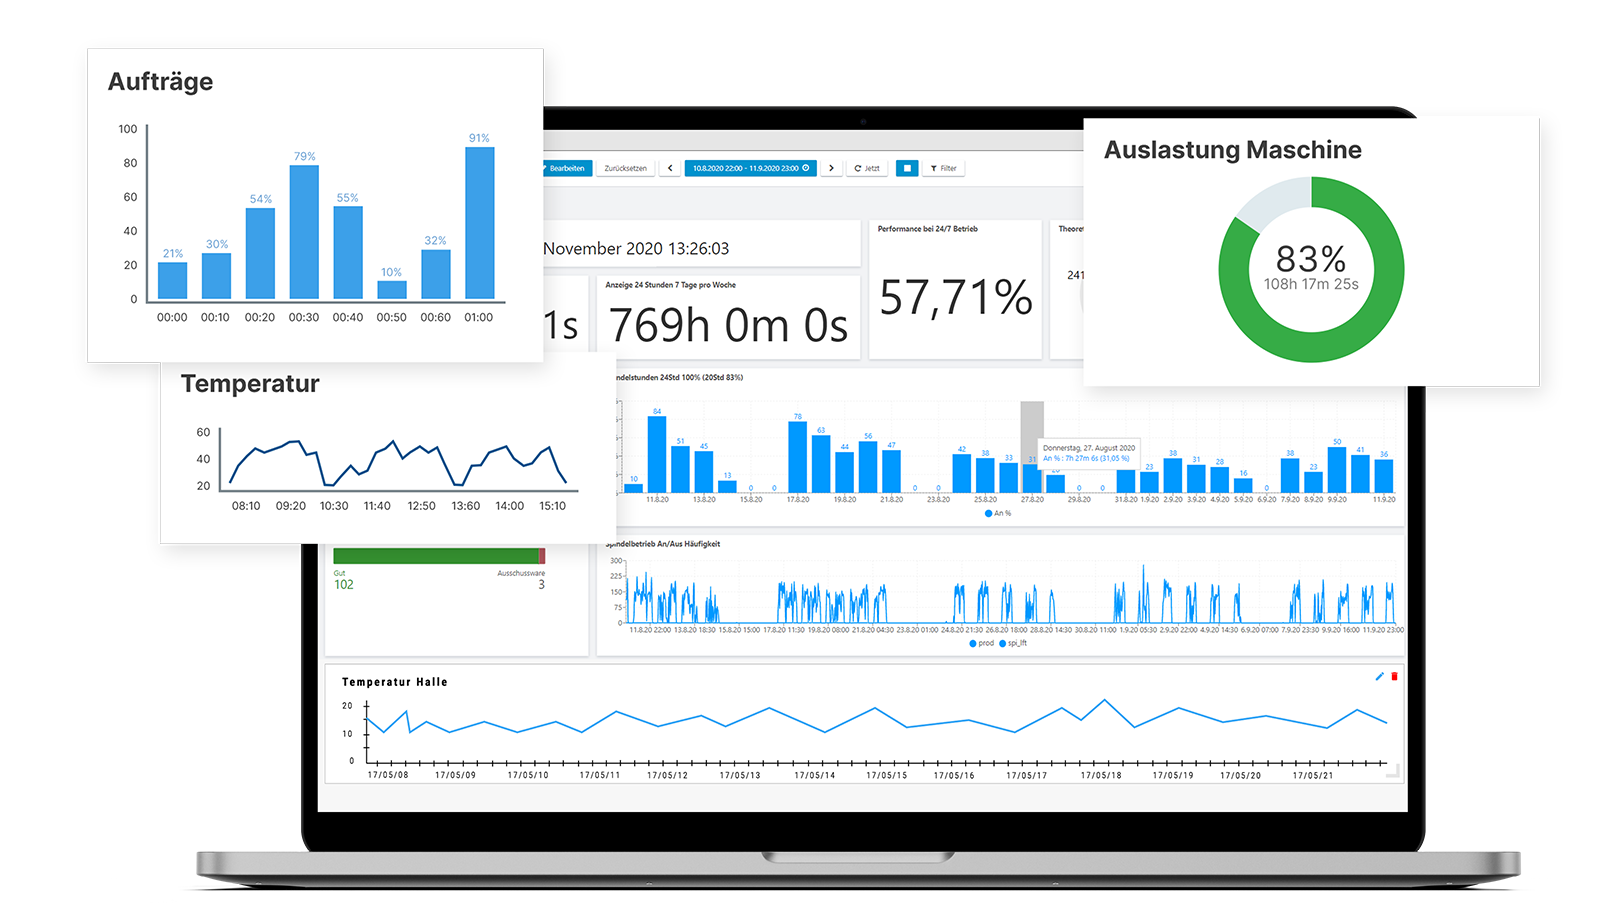
All data sources such as facilities, machines, workstations, sensors or web services are digitally represented in the data visualization of the DAPONA web dashboards. However individual or distributed the data sources may be and from whatever perspective the data is viewed: Simply set up custom dashboards via drag & drop. Always matching the respective perspective. Without programming, editor or even training: simply and intuitively at any time directly in the web browser.
Alert, trigger actions
As soon as deviations occur, DAPONA triggers actions, reminds, warns and alerts.
Whether announcements and tasks of the next maintenance, warnings about anomalies, or alerting when limit values are exceeded: Via fully definable rules, any type notification can be easily triggered. The notification can be set up in any desired way, from e-mail, SMS, to WhatsApp or automated voice messages by telephone.
Daily report summarizes events of the last 24 hours.
All actions are logged and reported by e-mail notification upon occurrence or resolution. Additionally, DAPONA summarizes all events in a daily report. Furthermore, evens can be traced back in the real-time dashboards at any time.
Personal data hub
Safe, open for secure connections (API), completely scalable, self-monitoring
DAPONA stores all data in a secure database to which the customer has secure access at any time via the platform. Through an optimal configuration of the databases in combination with a modern software architecture, we offer a high-performance platform. For additional security, data is stored in a second database for long-term retention.
Always see what is happening, no longer miss anything, act in time.
What our clients say
What our clients say
“The functions and especially the usability of the application are truly practical and transparent.”
„Based on our understanding as a partner to our customers, we not only supply top quality machines, but also support efficient operation with DAPONA.“