
„I can now make safe decisions, because I always know, how high the workload is“
Never fly blind again
If utilization, progress or alarms are detected too late, delays and higher costs are usually the result.
More and more sensors and plants are providing their key data individually in their own apps. The decisive factor is a uniform view of the entire production, regardless of the type and location of the data sources.
Act in good time, avoid downtimes
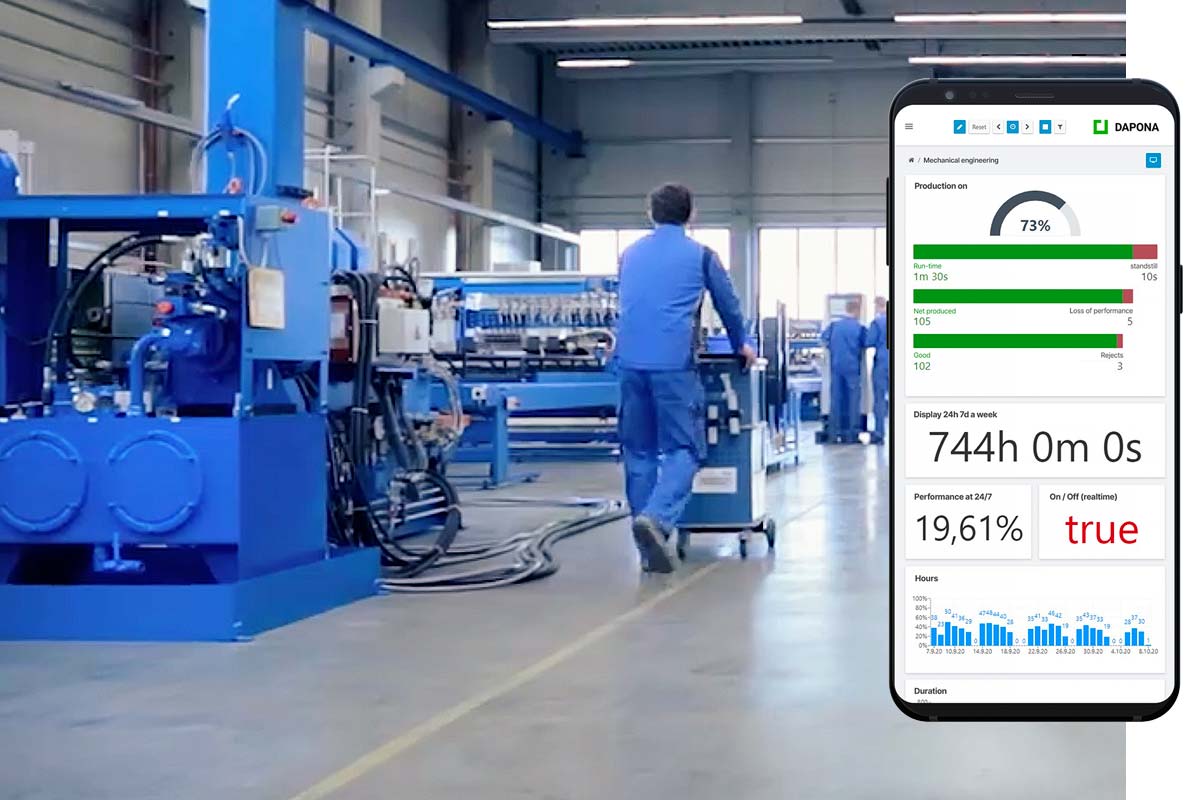
DAPONA has developed a standard webservice for data visualization that records any process parameters and makes them visible in real time and triggers tasks. And it does so regardless of the type and location of the data sources. In freely designable dashboards, own real-time views of the reality in production can be digitally mapped, independent of the type and location of the data sources. Simply in the web browser, even mobile, without app, boxes or designer.
Quelle: IDEAL Werk
Wie hoch ist die Auslastung, welche Fehler stehen gerade an, läuft oder steht die CNC Werkzeugmaschine?
Um ihre Effizienz in ihrer eigenen Produktion zu steigern ist es für IDEAL Werk elementar, die Auslastung in Echtzeit zu sehen um frühzeitig handeln zu können. Dazu wurde die CNC-Werkzeugmaschine mit DAPONA digitalisiert. Ohne Pogrammierung, einfach plug&play.
In selbst eingerichteten Dashboards ist für die Unternehmensleitung jederzeit die Auslastung sichtbar, ganz gleich ob im Unternehmen oder unterwegs.